Build New Zealand in an afternoon
This post is a walk-through of how to create an interactive 3D map of anywhere in the world. We will focus on New Zealand, but the same approach could be applied to anywhere.
When we’re done we’ll have simple app that lets us explore the beautiful national parks of New Zealand. You don’t need any knowledge of 3D rendering, just a basic understanding of how to build a website.
The plan
We will be needing several components to build this:
- Procedural GL JS: the rendering library that will do the heavy lifting,
- LINZ basemaps: the source of our satellite imagery,
- nasadem.XYZ: the source of our elevation data,
- a list of places to present to the user.
Procedural GL JS
The first step is to create a HTML file into which we will add our map component. There are many ways to do this, but we will just stick to using plain old HTML and not pull in any other frameworks.
<html>
    <head>
        <meta name="viewport" content="user-scalable=no, width=device-width, height=device-height, maximum-scale=1.0, minimum-scale=1.0, initial-scale=1.0">
        <link href="https://maxcdn.bootstrapcdn.com/font-awesome/4.6.3/css/font-awesome.min.css" rel="stylesheet">
    </head>

    <body>
        <div id="container" style="position: absolute; width: 100%; height: 100%;">
        </div>
    </body>
    <script type="text/javascript" src="https://unpkg.com/procedural-gl/build/procedural-gl.js"></script>
</html>
This page does nothing but load in the Procedural GL JS framework and create a div element that we will use to display our map in.
Before we configure this component, let’s take a look at the data we will be streaming into our map.
Satellite imagery
For our imagery we will use the LINZ basemap, which gives us a source of imagery data for our map. This is a great resource, as all the images are available under a open Creative Commons license. If only the rest of the world could be this progressive.
If you head over to the LINZ page you’ll see a map, and expanding the menu will give you the URL of the XYZ Tiles which you will need for configuration later. It will look something like this:
basemaps.linz.govt.nz/v1/tiles/aerial/EPSG:3857/{z}/{x}/{y}.webp?api=APIKEY
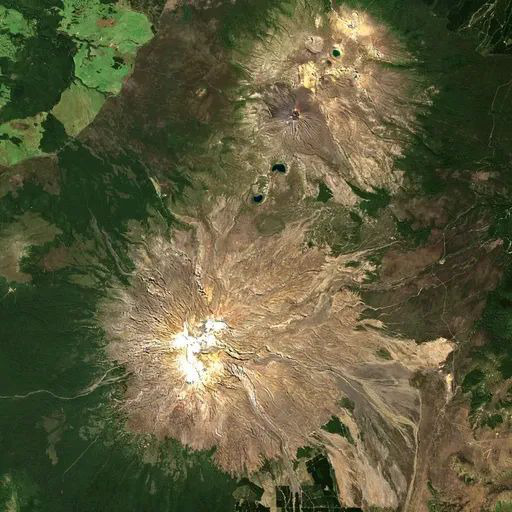
This is a template for URLs that we will pass in the Procedural GL JS framework. To see what the tiles look like, we can replace the x,y,z placholders for valid integers and obtain an imagery tile. z is the zoom level, while x and y specify the tile along the x and y axes within that zoom level. So, for example:
10/1011/633.jpg
looks like:
By sure to make note of the API key on the website, as it is changed frequently, and you will need it later.
Elevation data
We now have our imagery for the map, however we also need a source of elevation data to make things 3D. For this we will use nasadem.XYZ, which provides us XYZ tiles just like LINZ, except for elevation, rather than imagery. You can sign up here to obtain an API key.
The tile URLs then follow a similar pattern:
nasadem.xyz/v1/dem/{z}/{x}/{y}.png?key=APIKEY
It is interesting to look at what these elevation tiles look like, to understand better what is going on.
Picking the same location as that for the image tile, we get:
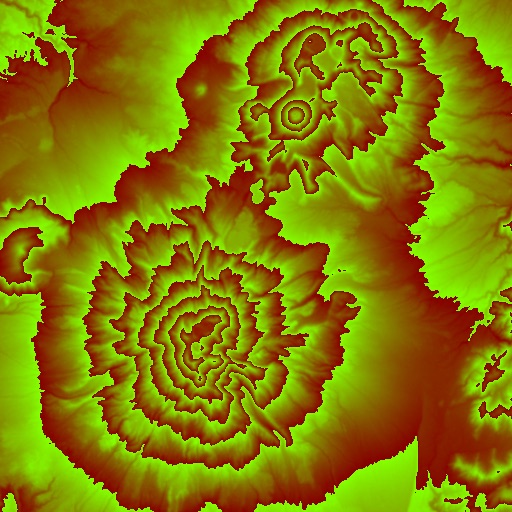
Notice how there are similarities between the two images, but the elevation tile has some weird colors going on, like a T-shirt of someone who doesn’t yet know the 60s are over.
The explanation is actually quite simple. Each pixel in the elevation tile corresponds to an height above sea level in meters, and because PNG images can only store 256 values in each color channel, this height is split across the color channels. To reconstruct the height in meters we can use this formula
height = ( 256 * r + g + b / 256 ) - 32768
Make me a map!
So, armed now with our API keys, we are ready to breathe life into the map.
First create a new file, new-zealand-3d.js and then include it in our index.html file:
<html>
    ...
    <script type="text/javascript" src="https://unpkg.com/procedural-gl/build/procedural-gl.js"></script>
    <script type="text/javascript" src="new-zealand-3d.js"></script>
</html>
Be sure to include it after the Procedural GL JS library.
Then initialize the library by adding the following code to the new-zealand-3d.js file:
const container = document.getElementById( 'container' );
const datasource = {
elevation: { apiKey: NASADEM_APIKEY },
imagery: {
apiKey: LINZ_APIKEY,
urlFormat: 'https://basemaps.linz.govt.nz/v1/tiles/aerial/EPSG:3857/{z}/{x}/{y}.jpg?api={apiKey}',
attribution: '© <a href="//www.linz.govt.nz/linz-copyright">LINZ CC BY 4.0</a> © <a href="//www.linz.govt.nz/data/linz-data/linz-basemaps/data-attribution">Imagery Basemap contributors</a>'
}
}
Procedural.init( { container, datasource } );
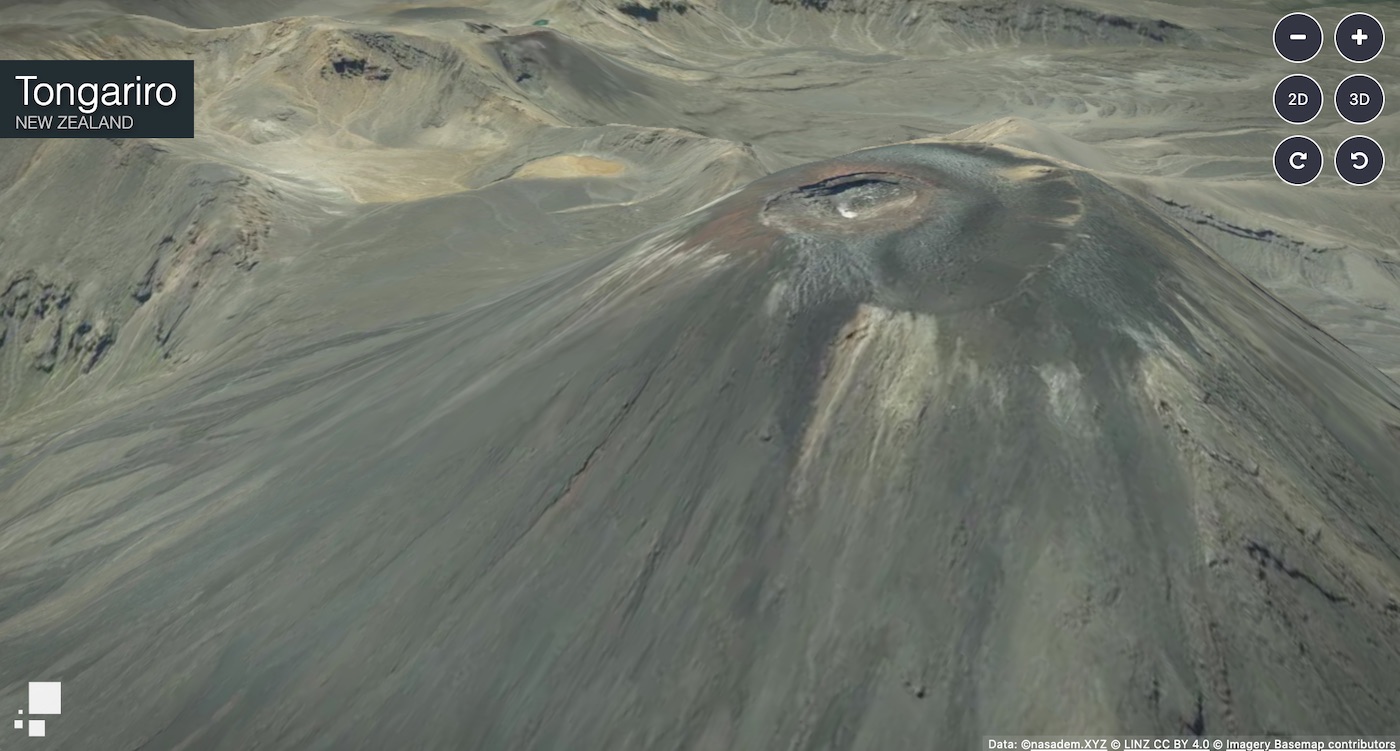
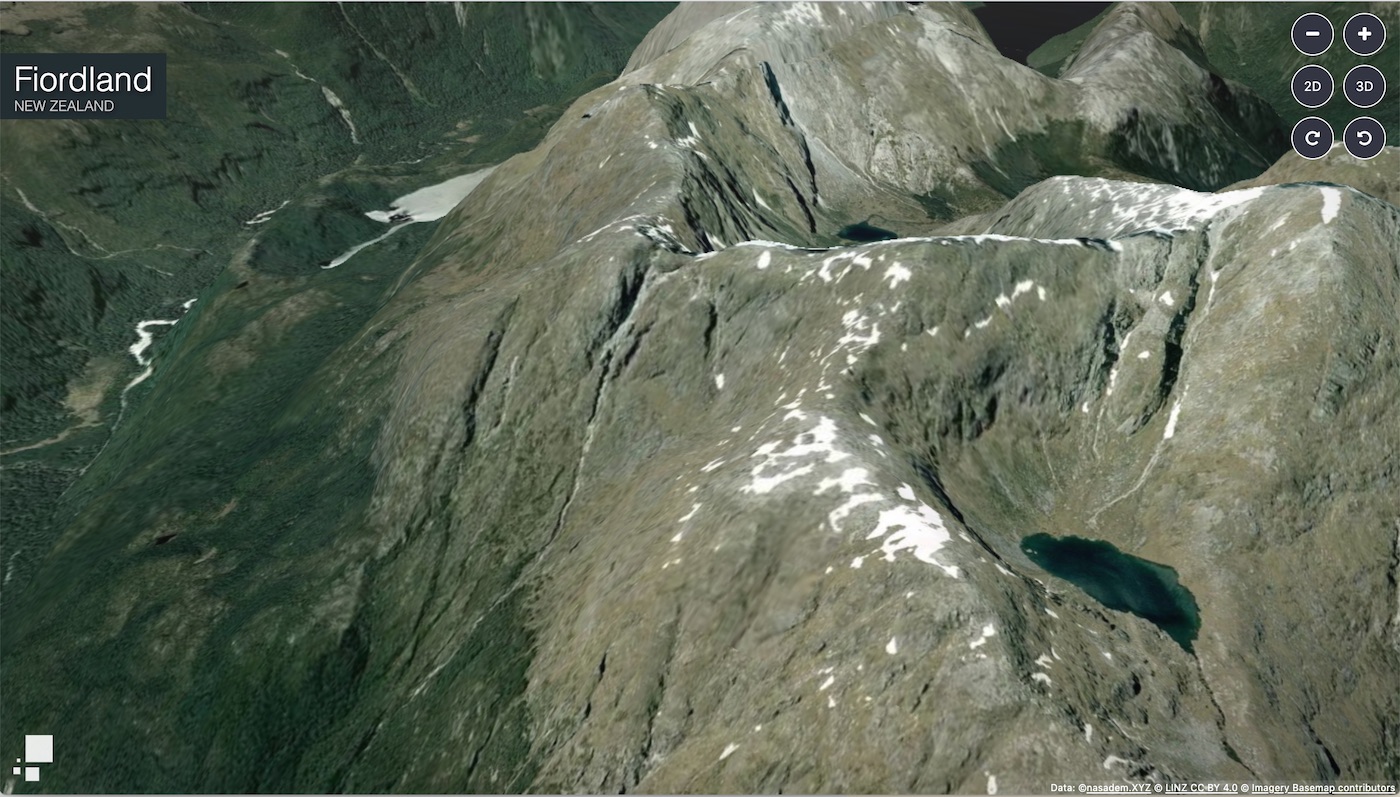
// Load in Fiordland
Procedural.displayLocation( { latitude: -45.38, longitude: 167.34 } );
Make sure you replace the API keys with those you obtained earlier!
Now all you need to do is host the index.html file with a webserver and view it in a web browser. If all goes well you’ll an see something like:
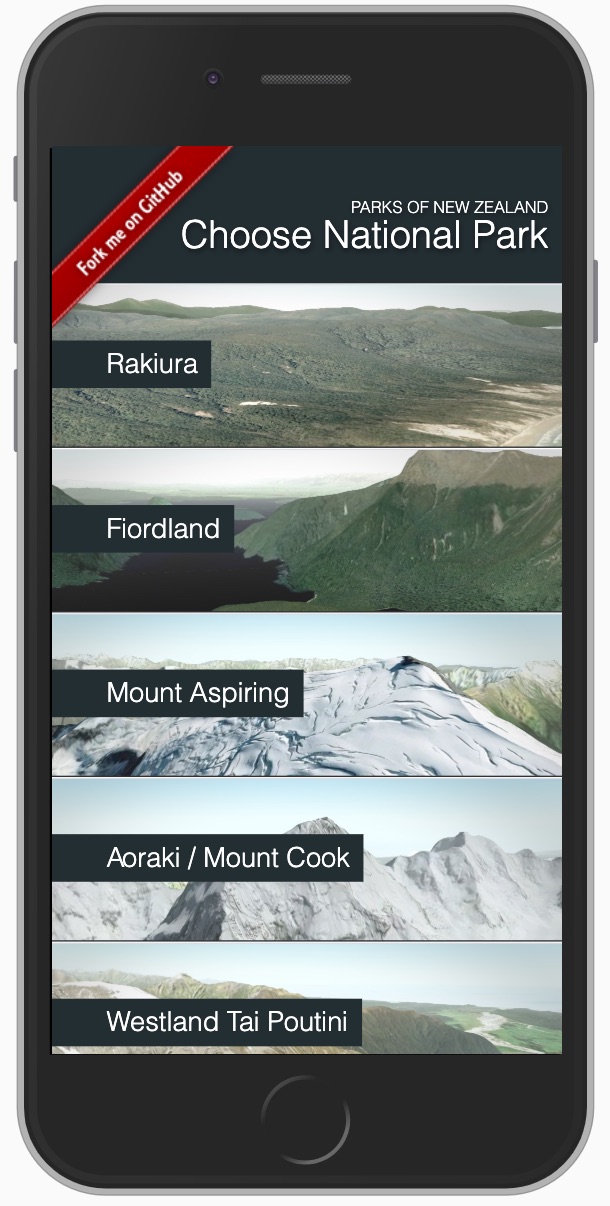
Places of interest
At this point we are basically done. By changing the latitude and longitude passed into the displayLocation API call we can display any location in New Zealand.
However it would be nicer to define a set of locations that would allow a user to quickly jump to a place of interest. A natural format to store this information is GeoJSON, which will let us visualize and edit this list using graphical tools, for example GeoJSON.io
How you build the user interface is then up to you, I’ve posted a simple implementation here. If you want to create a version using your own locations and data, just fork this repo and edit the parks.geojson file.
You can find the finished app here.